Applications and test cases
- Comparison with observations
- Test basins
- Comparison with benchmark numerical solutions
- Analytical modeling (coming soon...)
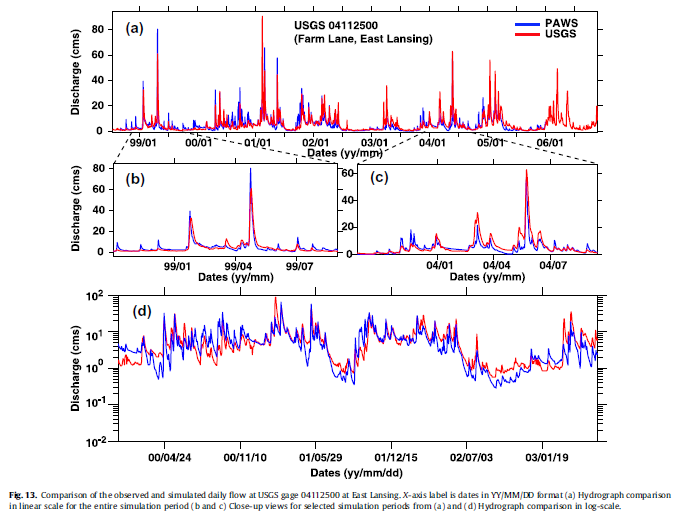
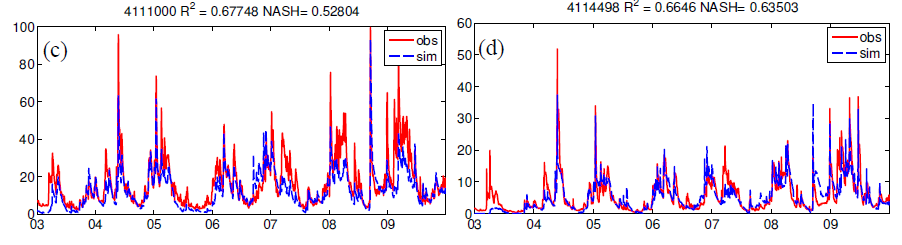
Streamflow records

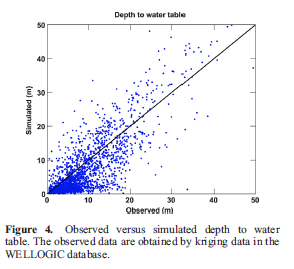
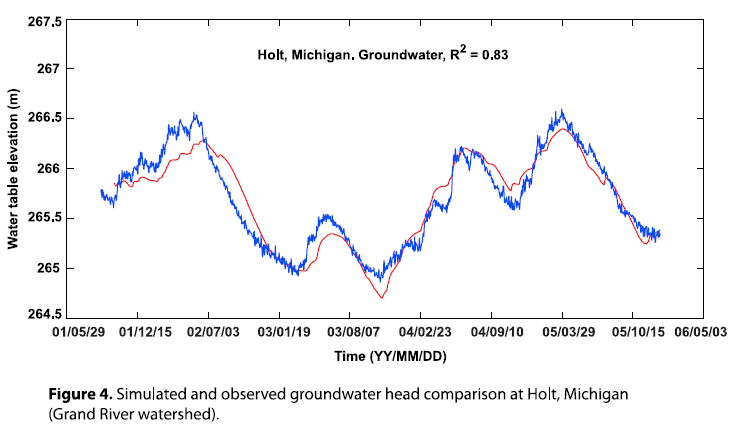
Groundwater records
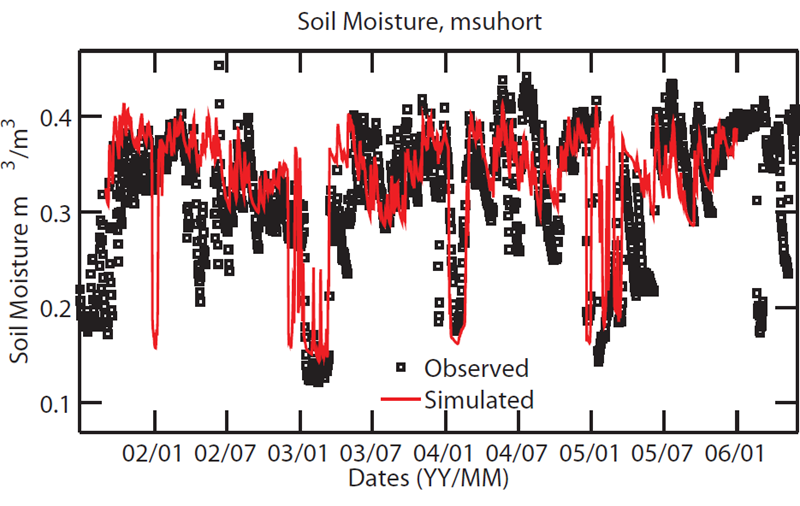
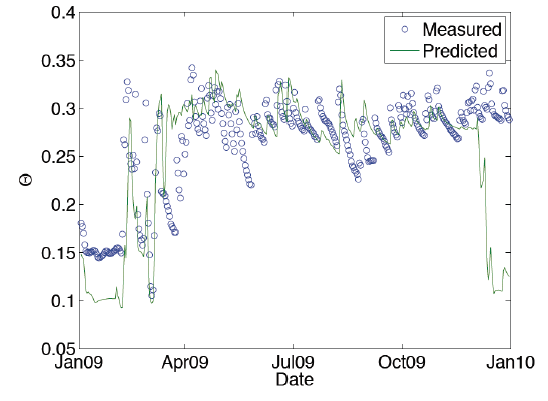
Soil moisture
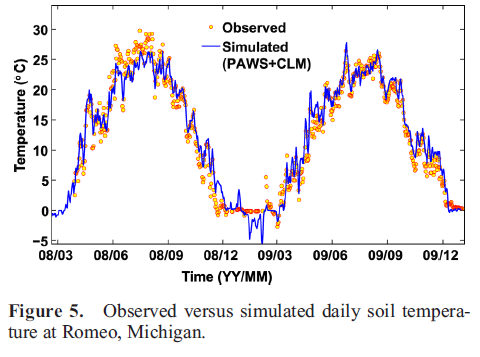
Soil temperature
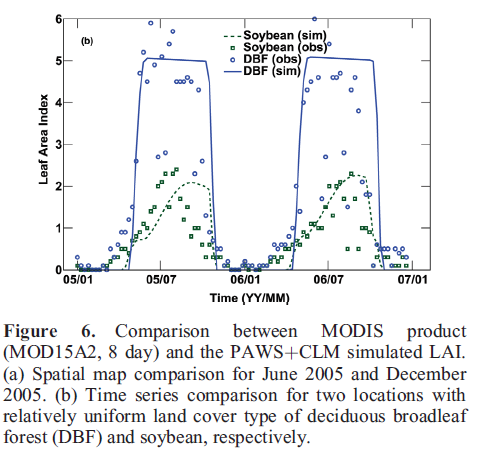
MODIS-based Leaf Area Index (LAI)
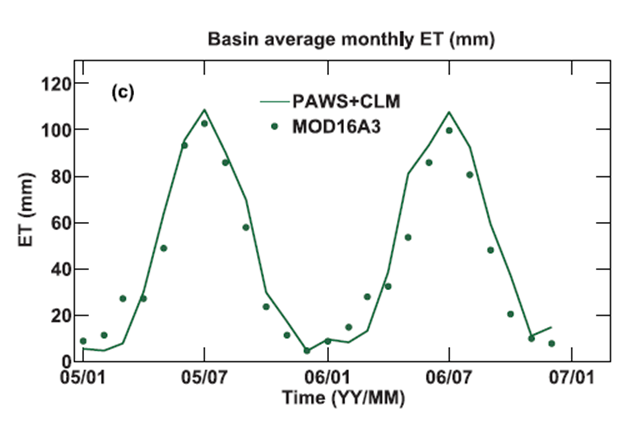
MODIS-based ET estimates
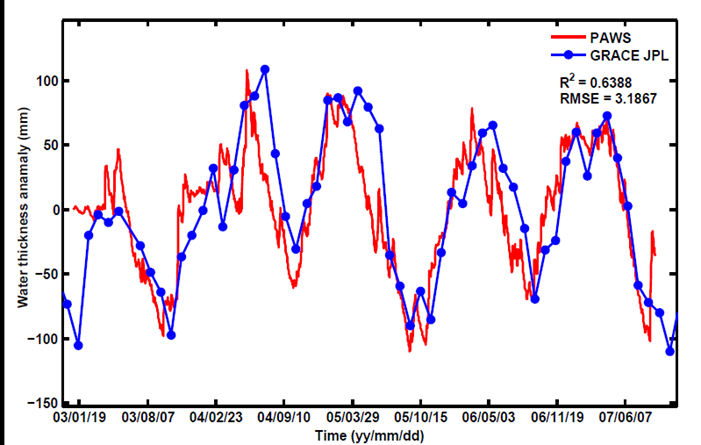
GRACE (Gravity Recovery and Climate Experiment)
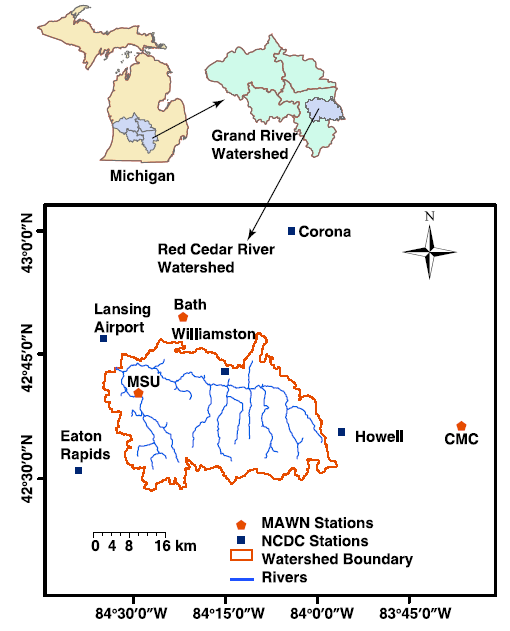
Red Cedar River watershed (1169km2)
Clinton River watershed (1837km2)
Upper Grand River watershed (coming soon...) (4531 km2)
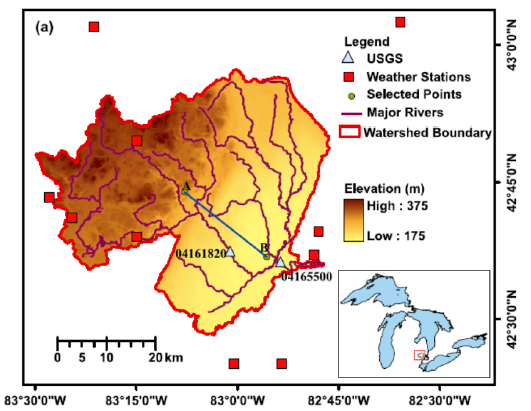
Grand River watershed (14430 km2)
Saginaw River watershed (22260 km2)

Kalamazoo River watershed (5200 km2)
California Desert environment (coming soon...) (6711 km2)
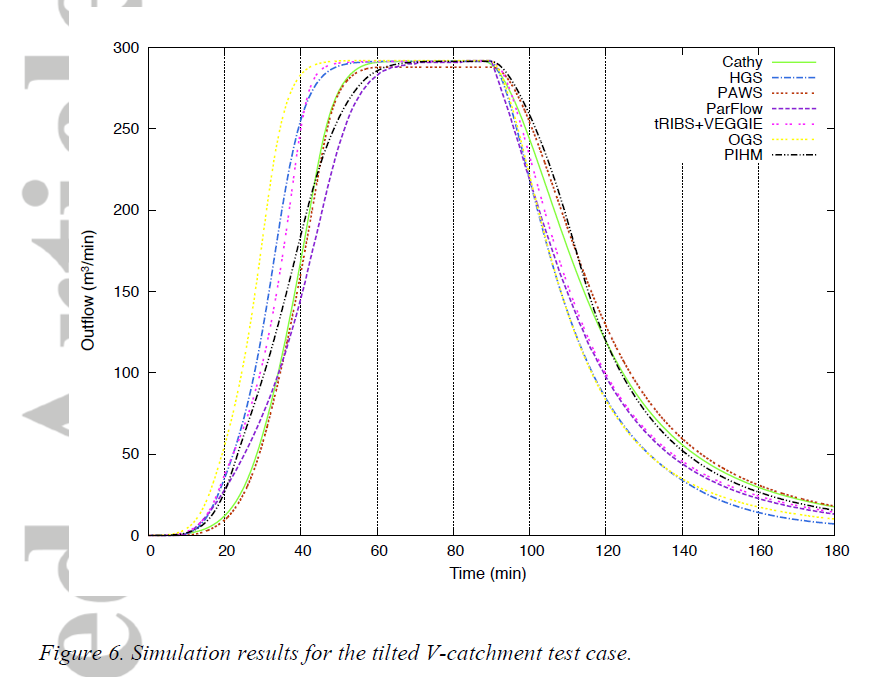
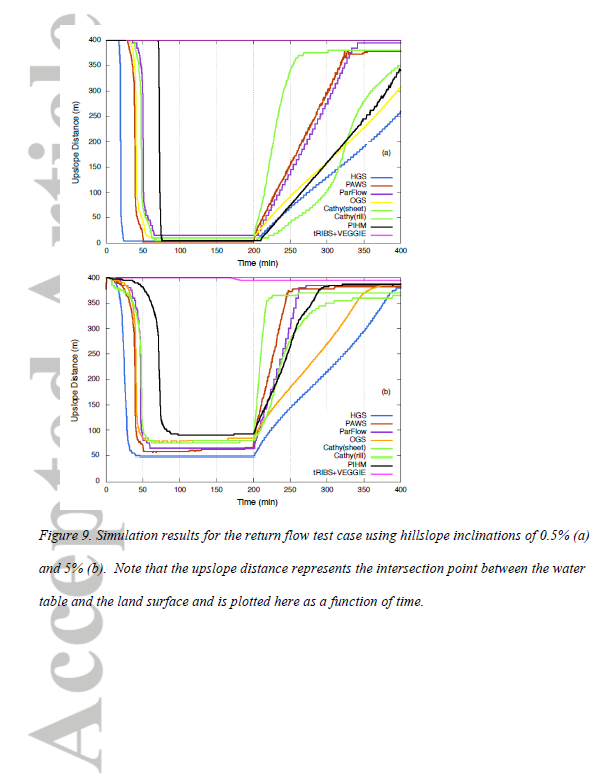
Extensive numerical test cases have been done (and continously added) to validate the numerical aspects of PAWS. Both surface and subsurface flow results are very favorable, compared with analytical solution, experimental results and 3D models
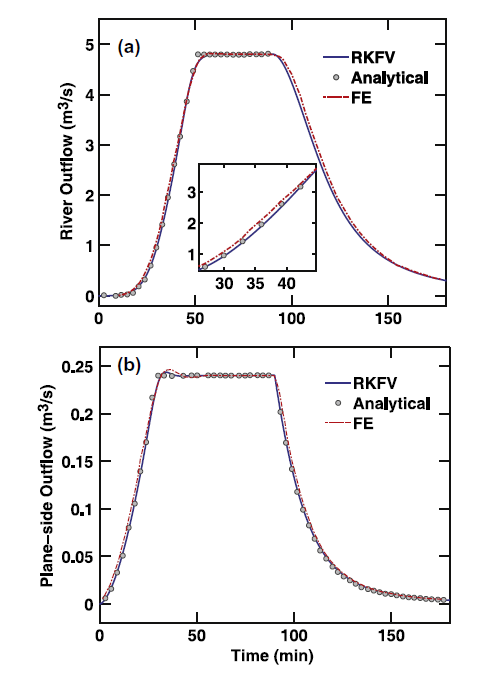
V-catchment
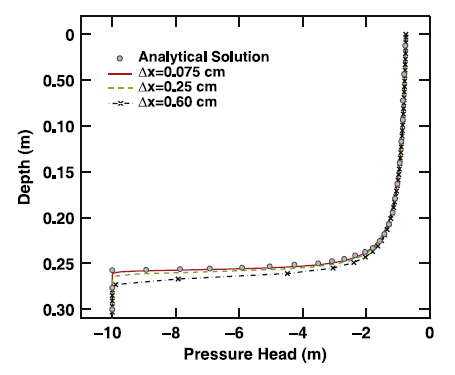
1D infiltration
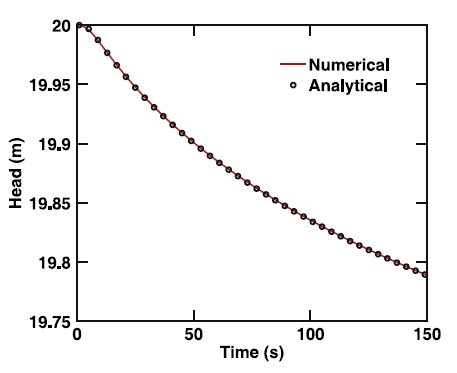
2D saturated groundwater mdoel
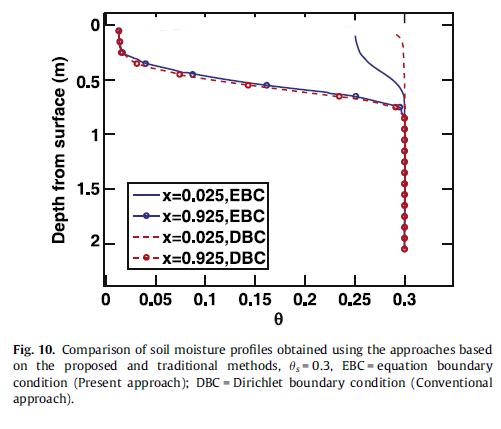
Compared to some other simplified methods (e.g. Dirichlet lower boundary condition), the soil moisture profile is consistent with the groundwater table. The Dirichlet BC will require that saturation point in the moisture profile be higher than GW table if there is recharge going to the phreatic water table.
Comparison between PAWS and some 3D models. (a) and (b) are saturation excess, (c) and (d)
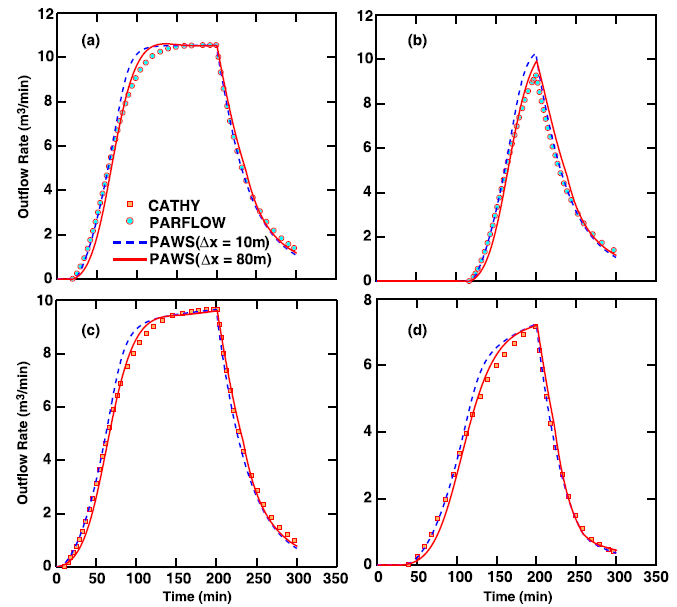
(Shen and Phanikumar 2010)
(Maxwell et al. 2014)